Read project analytics
Review project traffic, visitor, bot, and completed-review activity over the last 7 or 30 days.
Project analytics describe traffic and feedback activity for the selected project. They do not combine every project in the organization.
Review the summary
Read the four activity metrics
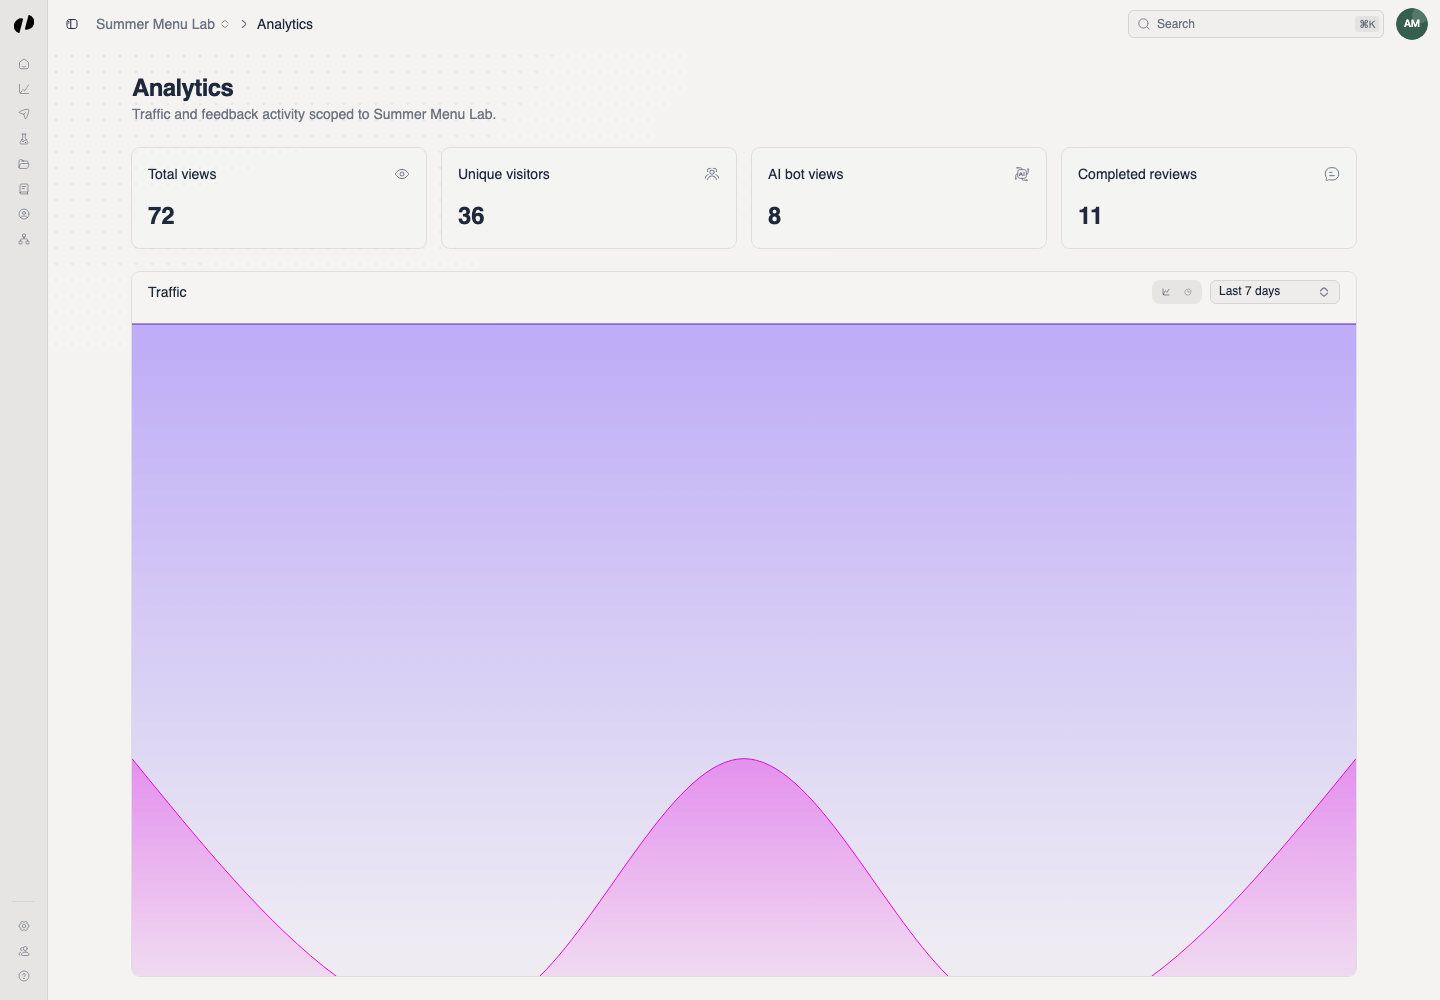
Open the project's Overview and select Bot Activity, or open its Analytics page directly. Check these cards:
- Total views counts all recorded views.
- Unique visitors removes repeat visitors from the total.
- AI bot views identifies recorded automated traffic.
- Completed reviews counts finished review submissions.
Read the Traffic chart
Choose a period and chart view
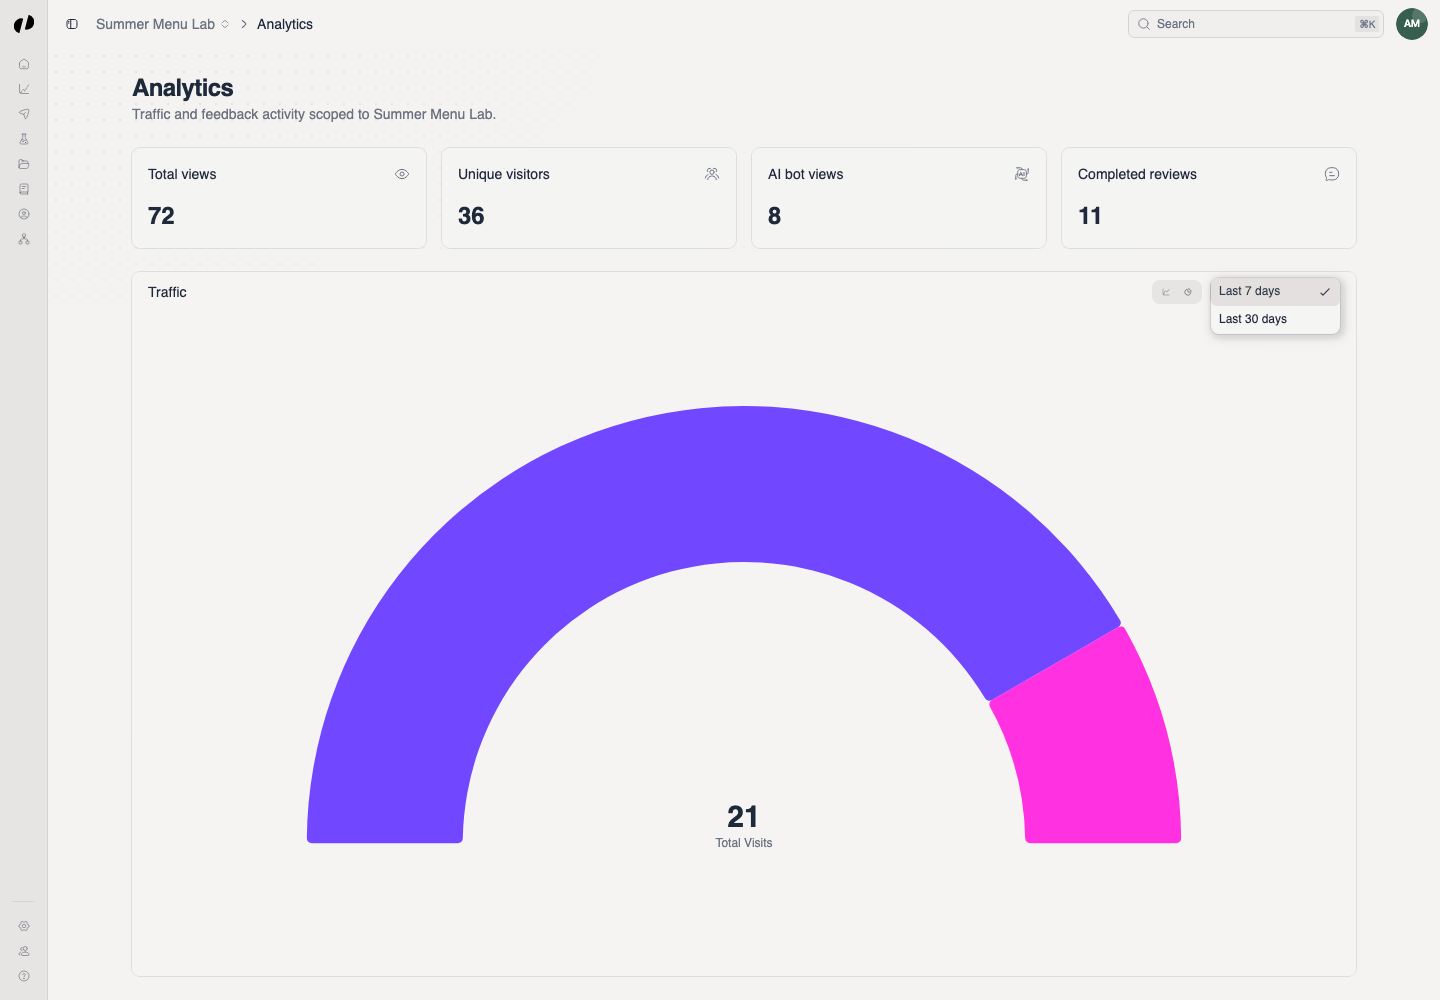
Use Last 7 days for recent changes or Last 30 days for a broader trend. Switch between the area and radial chart controls:
- The area chart compares total views with AI bot views over time.
- The radial chart compares AI bot visits with non-AI visits for the selected period.
Compare traffic with completed reviews
Compare traffic with completed reviews before drawing a conclusion. A traffic increase without more reviews can mean that visitors reached the project but did not finish the review flow.
If every value is zero, confirm that you selected the intended project and date range. Reload once if the page reports Failed to load project analytics.