Analytics
See who visits a project's page, people as well as AI agents and bots, and how many visitors go on to complete an opinion.
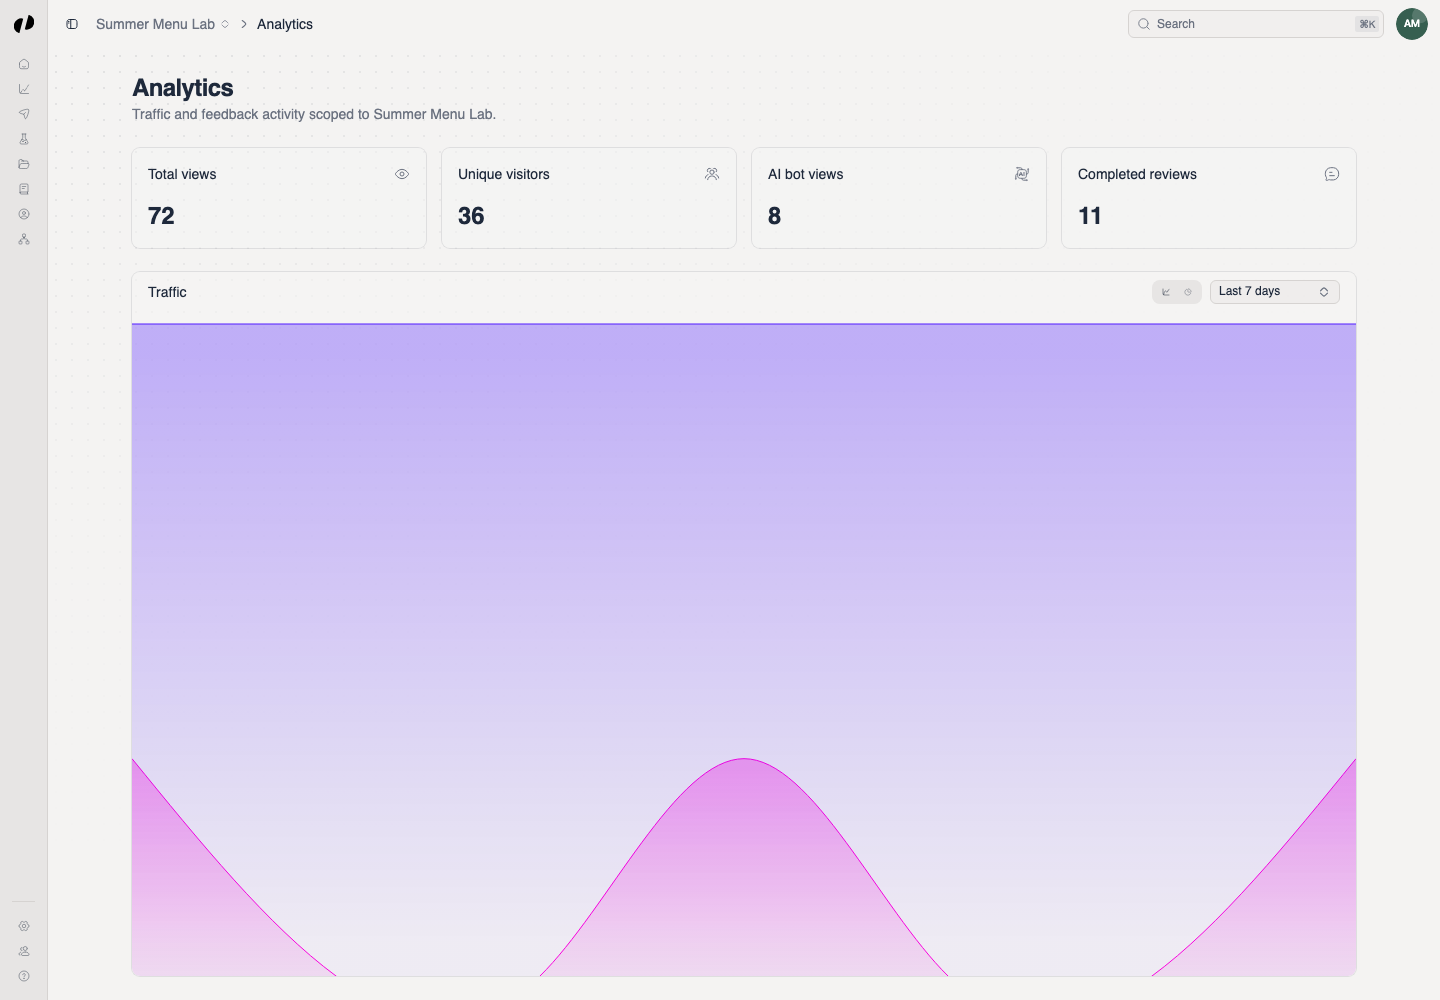
Each project's analytics live on its Overview: how many opinions, subscribers, and questions it has, how many AI agents and bots read its page, how customers feel about your priorities, and what needs your attention next. There's no combined view across projects.
The overview cards
| Card | What it counts |
|---|---|
| Opinions | Opinions customers left on the project. |
| Subscribers | Customers subscribed to the project. |
| Questions | Questions the project asks. |
| Bot activity | Pages fetched by AI agents and bots, including the text version AI tools read. |
Each card shows the change from last month. Select a card to open its page; Bot activity jumps to the Traffic chart.
Days follow your store's time zone, set under Manage Settings → Location, or UTC if you haven't set one.
The Traffic chart
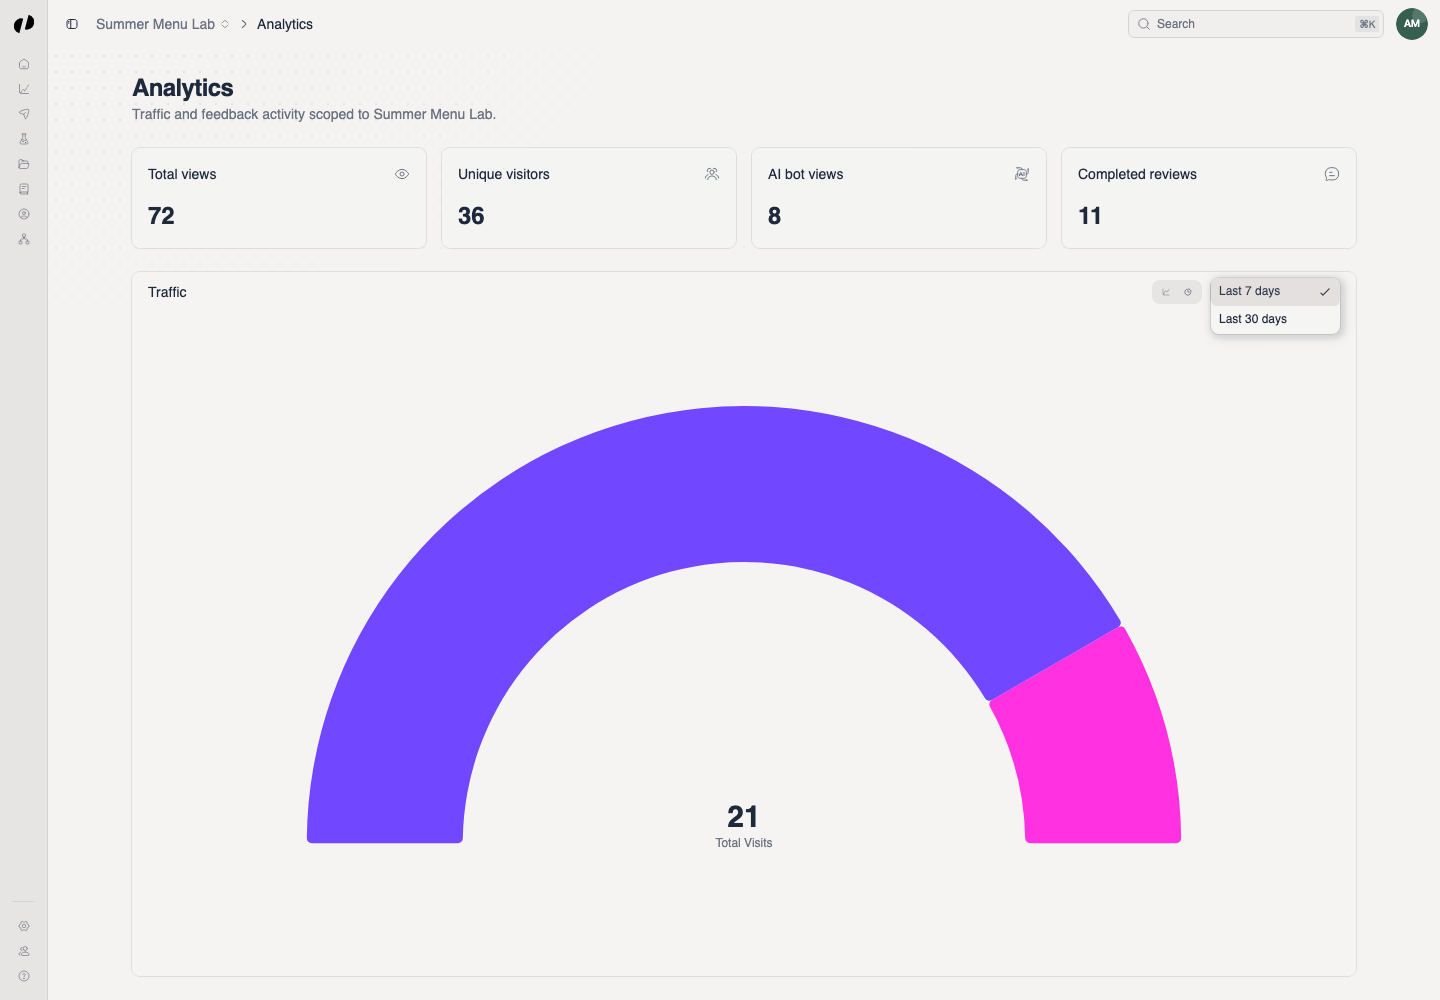
Choose Last 7 days for recent changes or Last 30 days for a longer trend, and switch between two charts:
- Area chart: human views and agent visits over time.
- Radial chart: the share of human views versus agent visits in the period.
How customers feel
How customers feel shows each priority you picked, scored from −100 (every answer negative) to +100 (every answer positive). The bar grows right in green for a positive lean and left in red for a negative one. A priority shows — until answers reveal how customers lean on it. Hover a bar to see its positive and negative shares.
Needs attention
| Row | What it shows |
|---|---|
| Waiting for a reply | Opinions you haven't replied to. Select it to open them. |
| Weakest priority | The priority customers feel worst about, with its score. |
| Goals | How many goals the project has. Goals steer automatic question priority. |
Reading the numbers together
| What you see | What it might mean | What to try |
|---|---|---|
| Views up, opinions flat | People visit but don't finish. | Check you're asking at most a few questions, and that your project description says why their opinion matters. |
| Few views at all | Customers aren't finding the project. | Put a QR code where customers are, or add the website form. |
| Lots of bot activity | AI tools are reading about you to answer people's questions. | Keep your Storefront details accurate and complete. |
If something looks wrong
- Every number is zero: check you're in the right project and period.